Monitoring heating oil levels with a webcam
Challenge: measure the level of heating oil in a tank (in a rental house) non-invasively and on the cheap.
Requirement: works with an oil tank of milk-white plastic where you can optically see the oil level through the wall of the tank.
Step 1 – get an IR PTZ webcam
I got a DBPower VA033K+ webcam for <30EUR on Amazon. It has a resolution of 640×480, infra red lamps, pan/tilt/zoom and even a plastic wall mount. Mount it in your oil tank room so you have a good view of the oil tank:
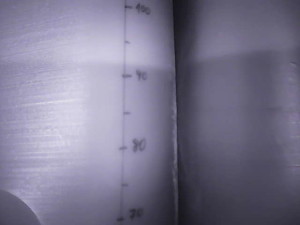
Step 2 – mark the oil tank
Like above, use a marker to draw a vertical line down the side of the oil tank, and mark it every 5cm. Move the camera (if it has PTZ (Pan, Tilt, Zoom) you can do this without even getting out of your chair!).
Step 3 – how many litres per cm?
This involves a certain amount of guess work, and a lot of inaccuracy… we have 3 x 3000l tanks, and it works out at about 35.37l/cm. Of course the bulge of the tanks will make that vary over the height, but it’s a good enough value for me to work with. As you can see, I chose to monitor a 30cm section to get higher resolution – I will have to move the camera over the course of the year as the oil level decreases. The precision at this resolution is pretty phenomenal: 30cm at 480px == 0.0625cm / pixel == 2.21l / pixel
Step 4 – Convert the image to litres of heating oil
I used imagemagick to:
- take a a 60 pixel vertical strip just left of my marked line
- use edge detection to highlight the boundary
- reduce to a 1-pixel wide strip
- output image to a text file
This is all wrapped in a perl script (webcam-oiltank-monitor) which further identifies the boundary (black line == RGB value 0,0,0), and calculates the exact cm height interpolating from a mapping where I have noted the height in cm of the pixels of my reference line. The height in pixels is then converted to litres with the conversion rate noted above.
The script also outputs an image file to confirm that the correct height was identified by painting a red line:
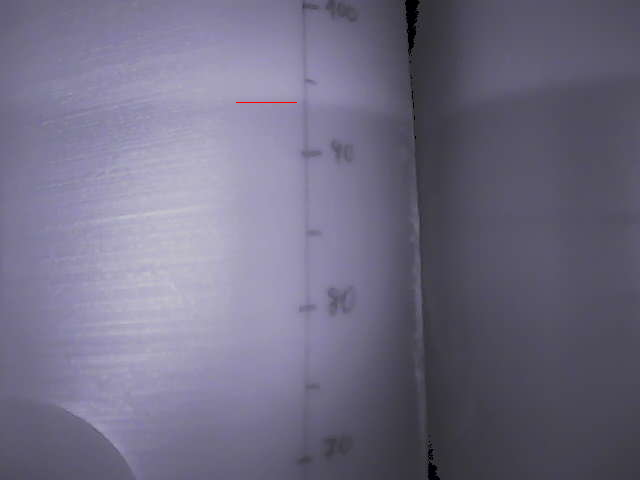
You might need to fiddle with the brightness and contrast settings to get it to identify the line well…
Step 5 Monitor
Feed the output of the script through logstash to elasticsearch and display with kibana:
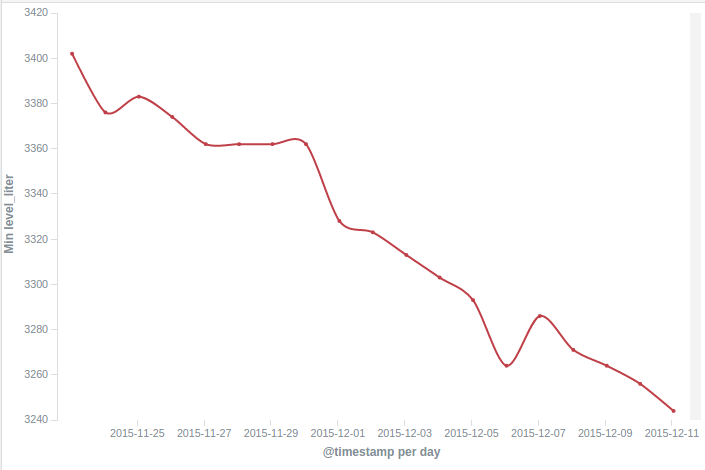
As you can see, it’s only been monitoring for a couple weeks, but it will be interesting to follow this over the course of a year!
Issues
- Power failure – the camera that I used scrolls full left-right and up-down before resuming its position if power is lost, and the position it gets is close but not exactly where it was before. Either add a UPS (as the camera I use runs on 5VDC, a USB battery bank which allows simultaneous charging/discharging would work), or kill the PTZ and lock the camera in place.
- It seems there is some balancing system (a fuel pump?) between the tanks such that level in the tank I am monitoring goes down a while, then bounces up as the level in the neighbouring tank goes down… this makes for odd bumps in the data, but over the days it averages out.
You can follow any responses to this entry through the RSS 2.0 feed. Both comments and pings are currently closed.