My first Dancer webapp

January 9th, 2012 robin Posted in Ironman, Perl 1 Comment »

Dancer is YAPWF (Yet Another Perl Web Framework), in the same bucket as Catalyst.  To date I’ve done most of my webapp development on Catalyst, but at the last German Perl Workshop @bano99 introduced me to Dancer, so I wanted to give it a try.

This is the webapp which resulted.

The backend

Behind the scenes I have a home built micro-controller web server controlling the temperature in a refrigerator to bring our turtles into a healthy winter hibernation.  A perl script regularly (once per minute) queries the current status from the micro-controller, and logs the data (temperature in the tank, the refrigerator, room, humidity, and switch state) to a (SQLite) database.  So, I have some interesting data, and want to make that web accessible – how well suited is Dancer to the task?

Turns out: very suitable!

Dancer is

  • super quick and easy to get started with: 2 minutes tops to get a basic web application running, including installing Dancer with cpanplus.
  • very intuitive for the basic stuff – in my case I had a template for the webpage, a database handler to get the data, and a method to do some basic analysis and pre-processing on the data before returning it to the client as json.
  • a bit procedural… it is possible to develop an OOP app with Dancer, but with its background singleton and plethora of new syntax it feels like, and encourages procedural practices.

Dancer is not (IMHO)…

  • a framework which will force/cajole you into using good design practices (OOP, MVC).  You can be quick’n’dirty with Dancer, which depending on your standpoint can be a pro or a con.
  • easy to understand the inner workings.  You may hate the global $c in Catalyst to which everything is bound, but … you do know what to bind stuff to, and you do know where to find it.  In Dancer there is (even) more hidden magic.
  • for special wishes.  For example for something as simple as having “Expires” http headers for static files, I had to add a after_file_render hook.

Better, Faster and Cooler

Some other stuff I did on the way to make it BFC:

  • Used jqPlot for the graphs.  I really like it!  I used to be into OFC, but jqPlot is faster, more versatile, and the big kicker: doesn’t require Flash!  Try out the zooming and mouse-over effects!
  • Data compression: originally the data for the charts weighed in at over 2MB…
    • Reduce repetition: for the graphs, the data requires an array-of-arrays with each value paired with the relevant date.  Rather than transmitting the 5 finished array-of-arrays (each with its own set of date data), I now transmit just the 4 data arrays, and the date array, and then build them as jqPlot requires them with javascript clientside.  This reduced the transmitted data from 2MB to ~400KB.
    • Deflate the data – by using Plack::Middleware::Deflater I was able to further reduce the transmitted data to ~40KB
  • Using Plack and Starman to easily put the webapp online.  Wow… that makes the transition from development on localhost to full deployment serverside childsplay!
  • Using Varnish to cache the pages server-side.  Some people make the effort of serving the static elements of a web app via a light web server, and while this has its merits, I prefer a contiguous web app which is complete in itself, and by applying the appropriate Expires http headers, let a reverse proxy do the grunt work.  I set the headers for this webapp so the worst-case load on the back-end will only be 1 request every 7 Days for any of the javascript/css files, 1 per hour for the html page, and 1 per minute for the json data.  Go ahead and slashdot me… I think I can take it, even though there’s only 3 worker processes and it’s running off a SQLite database. 🙂

Summary

I will definitely be using Dancer again.  For any corporate and larger web applications I’d still prefer Catalyst, but for applications like this where I want to put something small online quickly, it’s the bees knees!
Turtle hibernation system

January 5th, 2012 robin Posted in Ironman, Perl 3 Comments »

Executive summary

We have two turtles who need to hibernate every winter.  Last year it was very difficult (I over-engineered) but this year it’s looking better, and there’s cool graphs to monitor their health!

Our turtles and their home

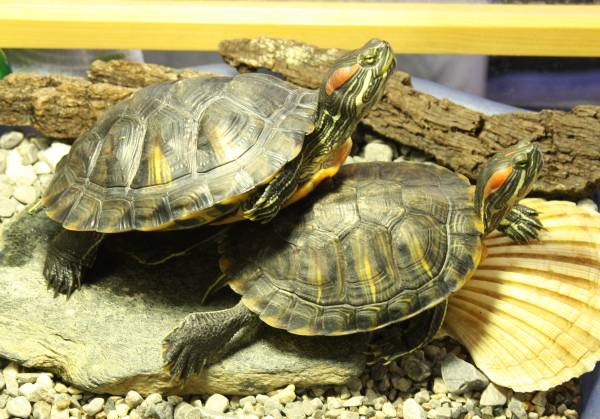
We have two red snapper turtles, Arthur and Turok:

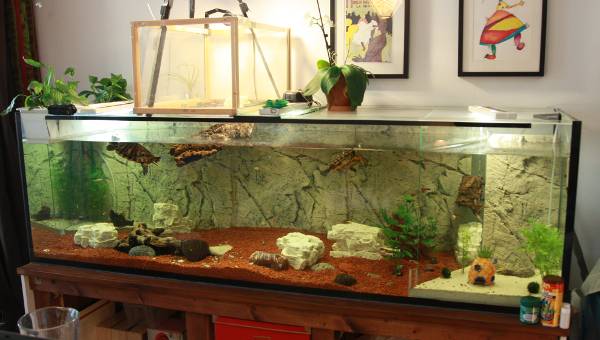
During the summer, they enjoy the huge (700l) aquarium in our living room

Aquarium

…but in the winter they should go into hibernation… They would survive without a yearly hibernation cycle, but it’s better for their health to go into hibernation.

Hibernation System 1.0

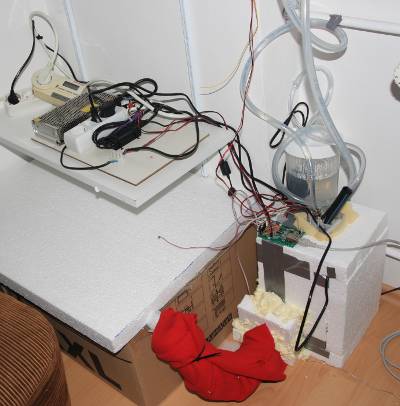
Last year I built a custom refrigerator:

This was a great learning experience (microcontroller programming, peltier elements, heat exchange, insulation, pumps, warm/cold water cycles…), but unfortunately not so effective… I was plagued with teething problems such as defective peltier elements, slime in the heat exchanger, ice crystalising in the warm water cycle… which resulted in a few unhealthy warm spikes in the otherwise stable “winter”…

Optimal hibernation

On recommendation from the local reptile institute we do the following hibernation sequence:

  • Over a 4 week period reduce the hours of  sunlight (150W full spectrum lamp over their island) and water temperature from the regular “summer” (10 hours/day at 25°C) to “winter” (3 hours/day at room temperature 20°C) over 6 weeks.  The regular aquarium lighting is also reduced from 12 hours/day to 6 hours/day (we can’t afford to let the plants and fish go so dark…).
  • Stop feeding 5 days before transfer to reduced activity phase.
  • For the reduced activity phase before complete hibernation transfer from the large tank (we can’t cool such a huge mass of water in our living room any lower than room temperature) and place into a smaller tank at ~15C in the cellar with only one hour of light per day.
  • Stay in reduced activity for about a week.
  • Transfer into individual small tanks (just big enough so they can turn around) with water temperature at 12°C and water level just over the shell (so the turtle can easily lift head to breath if necessary, but is completely submerged otherwise) and place in the temperature controlled refrigerator.
  • Reduce the temperature in the refrigerator by 1°C every 2 days until tank temperature is at about 6°C.
  • Every 2-4 weeks during the ~4 months of hibernation:
    • Change the water (should be done every week the first 3 weeks because they may still dirty the water with excrement, but it is ok if they don’t empty their bowels for hibernation!)
    • Weigh the turtle (a total weight loss of up to 10% during hibernation is acceptable, any more and an early spring should be induced)
    • Check for  any signs of sickness
  • About 3-4 months do the same again in reverse
If you only have turtles in your aquarium and can practice better light/temperature control, this is the perfect light/temperature sequence (German original), and a speedy hibernation sequence (German original)
If like us you can’t give them the optimal lead-in to hibernation, they may not recognize the onset of winter, and are still active when (based on the temperature) they should already be sleeping.  In this case, keep on track, and they will eventually (~2 weeks) fall asleep.  Again – as long as they don’t loose more than 10% of their initial weight, it should be fine!  You can also try reducing the temperature further (but not below 3°C as this will put them into a permanent sleep aka dead!)
Some people recommend continuing to feed the turtles during the “reduced activity” phase at 15°C. This is not a good idea because their digestive tract does not operate well at this temperature and puts a lot of strain on their liver.  For their health it is better continue reducing the temperature and induce complete hibernation.

Hibernation Control System 2.0

So this year I decided to do it a bit less complex and use tried and tested cooling technology: the old 80’s fridge in my girlfriends parents cellar.  The turtles need a very stable 4-8°C temperature to hibernate correctly.  Unfortunately the temperature in most fridges fluctuates too much, and the warmest setting on the old one we have is much too cold (4°C at ±2°C), so I still needed a custom control system…
I retained the core control system: a network enabled micro controller I built two years ago with several temperature and humidity sensors.  This time round rather than control a complex system of fans, pumps and peltier elements with it, I just hooked it up to a 230V relay to turn a regular power socket on and off, and plugged the old fridge into that socket… and it’s fantastically effective, and is much more efficient than last years system! 🙂

The software making the data visible

Using the powers of Dancer, Plack, Starman, and jqPlot, I put a small web app together to display the data.  Here’s a post about implementing the web application.


Displaying transit times on a map (Munich/MVV)

November 30th, 2011 robin Posted in google, Internet, Ironman, Perl 3 Comments »

A personal (but techy) project I’ve been doing on the side recently has just reached a milestone.
Some time in the next year we are going to move out of the city centre.  I want to live as far away from the concrete jungle, rumbling juggernauts and grumpy people as I can, but… it would be nice not to be too far away from friends, activities and shopping….

There are many parameters involved (and in time I will put them all on a map!), but probably the most important one is that our new home must be within a reasonable transit time by public transport of the city centre.  But reasonable is relative… if the new place is great it could be 40 minutes, for “ok” it would have to be less than 30, and “fantastic” might get us to stretch to 50 minutes.  The trips shouldn’t have a frequency (during the day) of more than 20 minutes either, otherwise we’d always be missing/waiting for a train…

So how can I visualise these regions on a map?

  1. Write an interface to the MVV (the public transport provider in Munich) web interface.  Unfortunately they don’t have a documented API, but they do have a RESTful interface, and a Java interface already exists (thanks Andreas!).  Between that and some further reverse engineering it wasn’t too difficult.  I’ll be publishing that module soon too. 🙂
  2. Localise all the stops in the region, and determine the transit times, and frequencies from the central station (Munich Hauptbahnhof) to each of the stops.  Throw all that data into a database for easy access. (SQLite is your friend).
  3. Write a Perl interface to Google Fusion Tables (there are interfaces in Python and PHP already, but I prefer Perl…).
  4. Analyse the data, generate polygons around each stop indicating the distance you could walk (assuming 4kmh average walking speed) from that stop after having travelled from the central station, within a time limit (10 minutes, 20 minutes, …)
  5. Convert the polygons to KML (that’s an XML variant which google uses for representing geographic data).
  6. Upload the polygons to Fusion tables
  7. Do some tweaking with the colouring so that the data is visually appealing and understandable.
The result is pretty, colourful, zoomable, responsive, and more importantly: shows me exactly what I want to see in a way which numbers in a table never could have: (click here to pop-out)

For my next party trick I’ll be putting proximity to shopping centres, parks on the map, and possibly doing the same representation for transit time with a car.  Any other ideas what would be relevant, and pretty on the map?